Zonalyze
A platform that tells entrepreneurs whether a business will work in a given location, across 26 business types and 552 Ontario municipalities, backed by real census data and three trained models.
The Problem
Opening a business in the wrong location is one of the most expensive mistakes an entrepreneur can make, and the data needed to avoid it (census demographics, competitor density, transit access) is scattered, raw, and unreadable to non-analysts.
Research
The first question was whether public data could actually answer a feasibility question. I spent the early weeks inside Statistics Canada's 2021 Census subdivision files, raw CSDs with hundreds of columns, inconsistent geography codes, and no obvious mapping to "should I open a bakery here?"
The answer turned out to be yes, but only after building a pipeline that transforms raw CSD files into a 45-feature model-ready matrix per municipality, joined with live OpenStreetMap extracts for competitor counts, transit stops, and commercial activity around a candidate location.
Because no labelled dataset of "businesses that succeeded or failed by location" exists publicly, I generated 50,000+ synthetic training records derived from real census feature distributions, a compromise I document honestly rather than hide.
The Solution
The platform is a multi-service stack: a React/TypeScript frontend, a FastAPI backend, PostgreSQL for scenario persistence, and a model service running three Random Forest models, a risk classifier, a revenue regressor, and a feasibility score regressor.
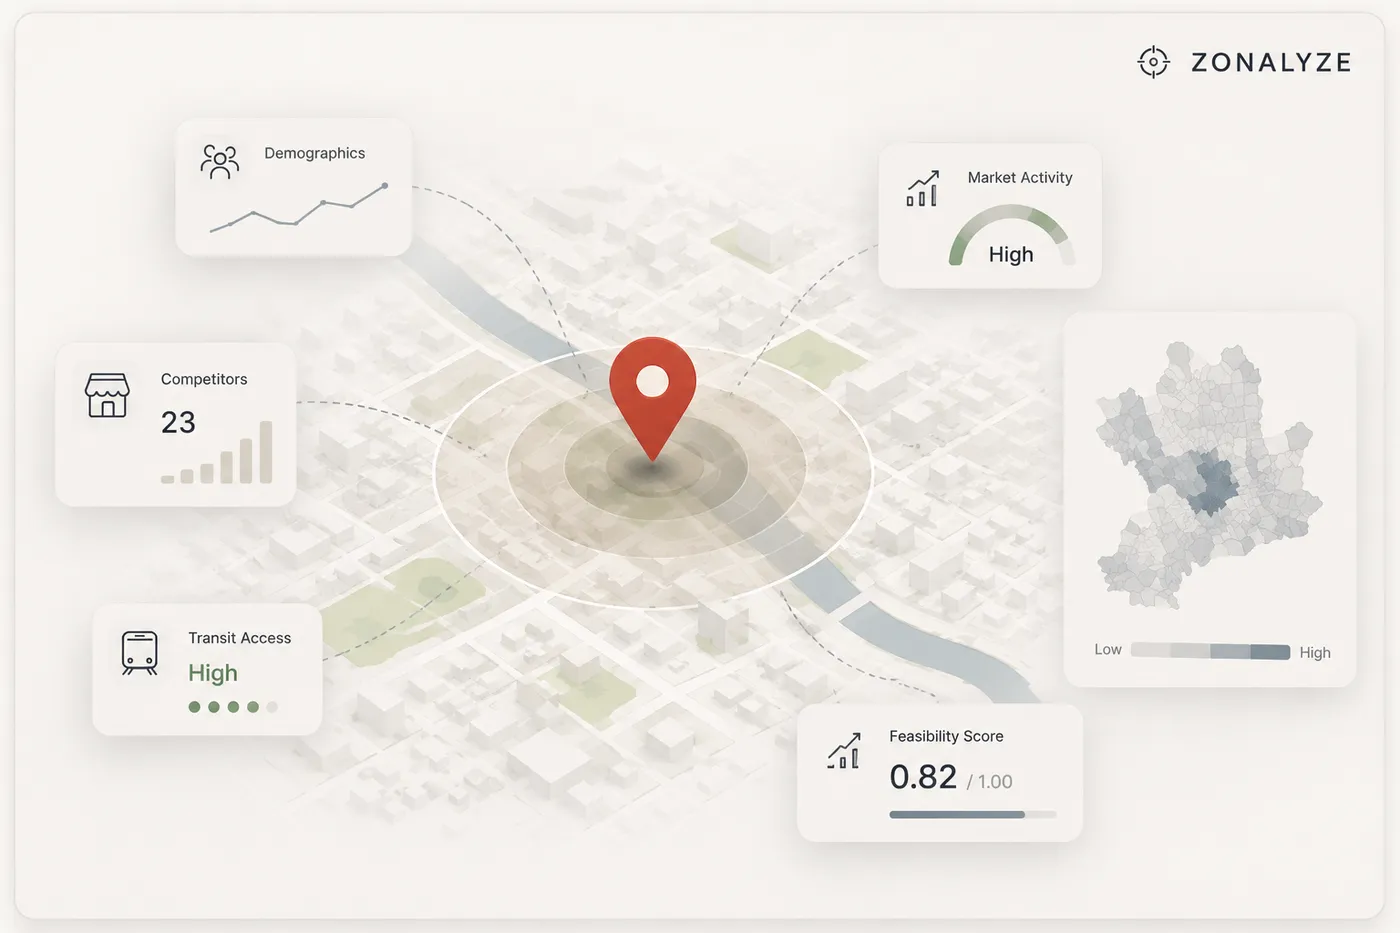
Results don't arrive as one blob. A centralized WebSocket message bus broadcasts updates to eight independent monitoring modules (demographics, competition, transit, market context, and more), each rendering as data lands, all within two seconds of a request.
On top of the numbers sits an LLM-powered chat that answers natural-language scenario questions ("what if I opened in Guelph instead?") against the user's own analysis history, plus investor-ready PDF export and multi-scenario comparison.
- Three production Random Forest models trained on 50,000+ records
- Real-time WebSocket bus feeding 8 monitoring modules in under 2 seconds
- Geospatial market mapping from live OpenStreetMap feeds
- Scenario history, comparison, PDF export, token-based auth
- Single-command deployment via Docker Compose
Technical Decisions
Random Forest over deep learning for all three models
With 45 tabular features and synthetic labels, tree ensembles are more sample-efficient, more interpretable (feature importances become user-facing explanations), and far cheaper to serve than a neural network.
Trade-off: A gradient-boosted model might squeeze out more accuracy; I chose interpretability and serving simplicity for a decision-support tool where users need to trust the 'why'.
WebSocket message bus instead of REST polling
A feasibility analysis fans out into eight independent computations of different durations. Streaming each result as it completes makes the app feel instant instead of blocking on the slowest module.
Trade-off: More connection-state complexity, reconnect logic and message ordering had to be handled explicitly.
Synthetic training data derived from real census distributions
No public labelled dataset links business outcomes to location features. Deriving synthetic records from real distributions let me train useful models while being transparent about the limitation.
Trade-off: Model scores measure fit to the synthetic generating process, not ground truth, which is why the UI presents scores as guidance with visible feature explanations, never as a verdict.
Docker Compose for the full multi-service stack
Five services (frontend, API, model service, database, chat) need to come up together for graders, teammates, and demos. One command, no environment drift.
What Didn't Go As Planned
Statistics Canada geography codes didn't line up cleanly with OpenStreetMap boundaries, so early joins silently dropped municipalities.
Built a reconciliation layer with explicit unmatched-code reporting instead of silent drops, coverage went from roughly 480 municipalities to the full 552.
The eight monitoring modules originally each opened their own WebSocket, which collapsed under concurrent scenario runs.
Replaced per-module sockets with one centralized message bus and topic-based routing; connection count per session went from 8 to 1 and updates stayed under the 2-second budget.
The LLM chat confidently answered questions about data it didn't have.
Constrained it to a structured context assembled from the user's actual analysis results, with an explicit "not in your analysis" pathway rather than letting it improvise.
Outcome
Zonalyze is my capstone and the most complete system I've built: data engineering, model training, real-time architecture, and product design in one stack. It's currently in active development toward final delivery.
Reflection
If I started again, I would design the feature pipeline schema-first, the 45-feature matrix grew organically and refactoring it mid-project cost a week. I'd also invest in a small labelled validation set from real business-registry data much earlier, to ground the synthetic-data models against reality sooner.